
Are you looking for an excel formula for stock prices in Excel? Well, Excel does have some capabilities here with the StockHistory function- but it’s pretty limited. For example, you can only get daily data with that function.
So, if you would like to build an excel stock chart, you’ll need to use something else. Fortunately, if you want real time stock data, you can use the free spreadsheet stock chart template provided here to get stock quotes in Excel.
In this template, stock market data is automatically pulled into Excel at five minute intervals. If you’re making frequent trades off of technical analysis, you can use this to build your own indicators for a stock. This template is an xlsx- so you don’t need macros or VBA for it to work.
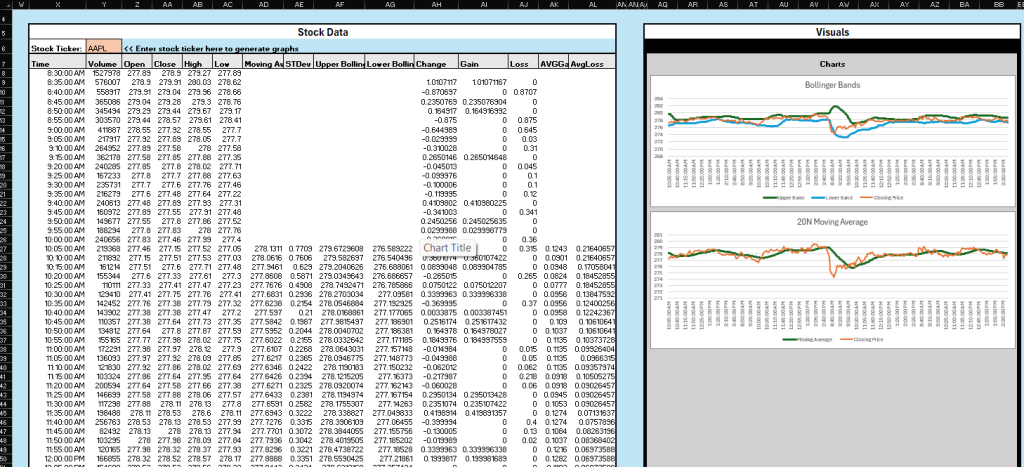
Getting started is easy- simply download the stock price template, then enter in the stock ticker that you are interested in monitoring. Data pulled includes the volume, open, close, high, and low for a specific stock ticker. In this template, indicators like Bollinger Bands and Moving Average (based on 20 5 minute intervals) are already included, but you can build more of your own.
Plus, this template has the capability to notify you conditionally when a stock meets a certain condition. For example, you can set it so that if the moving average is above $300, then excel will play a sound to notify you. With the free aspects of the Spreadsheet Text Alerts add in, the template even updates itself automatically every five minutes so that you can monitor for your trades. If you pay for the premium add in, then you can get text message or email alerts on your stocks as well.
Leave a Reply